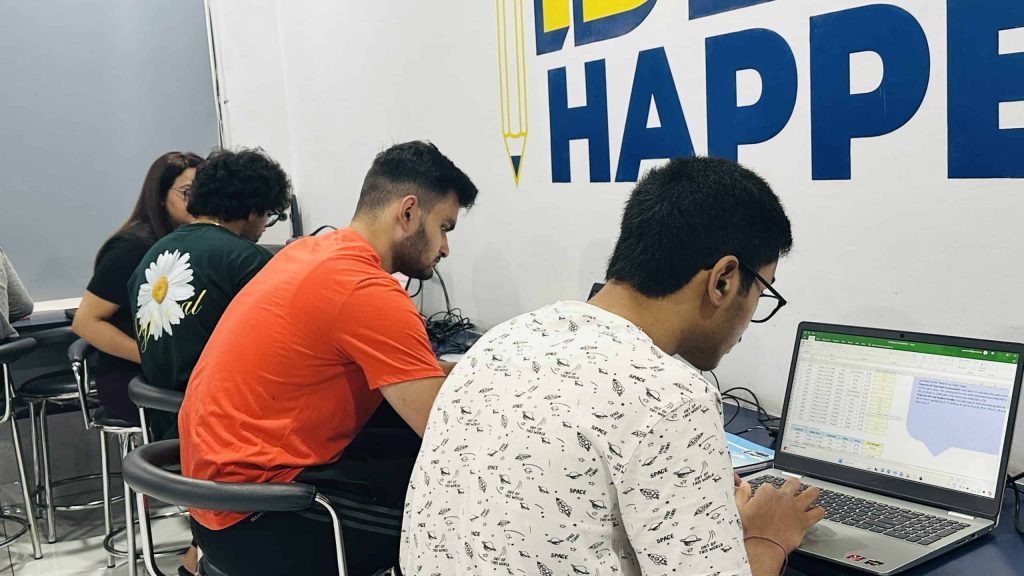

Learn Analysis In MS Excel With TechnoTykes
Critical Components Covered in Data Analysis Using MS Excel Course
- Data Manipulation: It is a significant part of the course as it teaches you how to adjust raw data into easily readable data using Microsoft tools.
- Data Visualization: Through Excel tools, you can convert dull-looking data into charts, tables and graphs. Learn this master skill of visualization from us.
- Statistical Analytics: Analyzing statistics is an essential function of Excel. Learn hypothesizing and analyzing statistical data in our Data Analysis using MS Excel Course in Ludhiana, Punjab.
- Pivot Tables and Charts: Learn advanced features of Excel, such as Pivot Table, to summarize and visualize complex datasets.
- Data Analysis Tools: Get comprehensive knowledge about tips and techniques for using tools efficiently. Learn everything about ToolPak in Advanced Data Analysis using MS Excel Course in Ludhiana, Punjab.
- Case Study-Based Learning: Get complete understanding of real-world scenarios based on assumptions through case studies. Reality-based case studies help you learn comprehensively about what-if analysis.
Programme Structure
We have divided the whole course into 12 sessions. Each session covers a different aspect of Microsoft Excel with theoretical and practical knowledge.
Session (1-2): Introduction to Excel for Data Analysis
In these sessions, you will get basic knowledge about interfaces and techniques. In this session, understanding the basics will be the focus.
Session (3-4): Advance data functions
Get into the functions of Excel, which are used for filtering, cleaning and organizing datasets.
Session (5-6): Data Visualization Techniques
Learn about various charts and graphs and acquire knowledge about the concept of visualization.
Session (7-8): Statistical Functions in Excel
Gain an understanding of mean, median, mode and correlation. Know function techniques that are used to analyze data.
Session (9-10) Advanced Data Analysis Tools
Get a comprehensive understanding of the concepts of What-If Analysis and real-world scenarios.
Session (11-12) PivotTables and PivotCharts
Explore the Pivot table and chart to present the data and learn about making reports.
The courses are for:
Students: Who want basic to advance knowledge about the concepts. We help them develop a crucial skill demanded by the industries in our Data Analysis using MS Excel Course in Ludhiana, Punjab.
Working Professionals: Those who want to enhance their skills for promotions or better placements. We offer you a better understanding of concepts and provide you with job-oriented training.
Reasons to Choose Us:
Learn from Experts: We have appointed industry experts with years worth of experience to teach you exceptional techniques.
Hands-on Training: Learn the skills with practical execution of formulas on the datasets based on real-life scenarios.
Flexible Batches: We have both weekday and weekend sessions, enroll according to your preference. Get your education flexibly with us.

